
In statistics and data analysis, understanding the right probability distribution is crucial. The Lognormal, Weibull, and Gamma distributions are important continuous distributions often used in engineering, finance, and reliability studies. While they may appear similar, each has unique characteristics, applications, and behaviors that make them suitable for different scenarios.
Lognormal Distribution
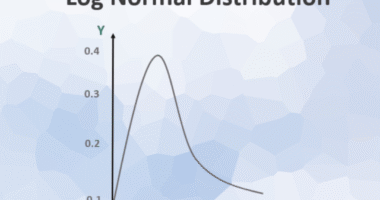
The Lognormal distribution models data that is positively skewed, meaning most values are concentrated at the lower end but with a long tail on the higher side. This distribution is appropriate when the data results from multiplicative effects rather than additive effects.
Key Characteristics:
-
Values are always positive.
-
Right-skewed with a long upper tail.
-
Often arises in modeling stock prices, income distributions, and biological measurements.
Example: The growth of a startup company’s revenue over several years often follows a Lognormal distribution because each year’s growth is multiplicative based on the previous year.
Weibull Distribution
The Weibull distribution is widely used in reliability engineering and failure analysis. Its flexibility allows it to model increasing, decreasing, or constant failure rates depending on the shape parameter.
Key Characteristics:
-
Can model a variety of shapes (right-skewed or nearly symmetric).
-
Widely used for life data, material strength, and reliability testing.
-
Shape and scale parameters determine the distribution’s behavior.
Example: The lifespan of a light bulb often follows a Weibull distribution. Engineers can estimate the probability of failure at different time intervals and design maintenance schedules accordingly.
Gamma Distribution
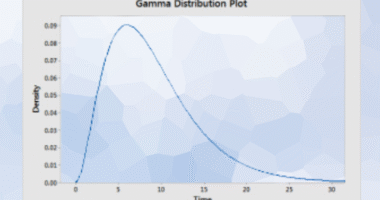
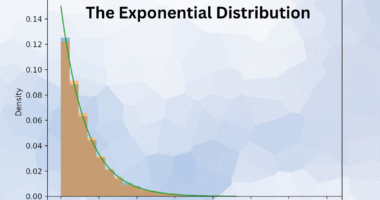
The Gamma distribution is useful for modeling waiting times or events that occur continuously and independently at a constant rate. It generalizes the exponential distribution and is closely linked to Poisson processes.
Key Characteristics:
-
Values are strictly positive.
-
Right-skewed, with skewness decreasing as the shape parameter increases.
-
Commonly used in queuing theory, insurance claims, and rainfall modeling.
Example: Modeling the total rainfall accumulated over a month in a region can follow a Gamma distribution, especially when the rainfall events are independent and continuous.
Key Differences at a Glance
| Feature | Lognormal | Weibull | Gamma |
|---|---|---|---|
| Data Type | Positive continuous | Positive continuous | Positive continuous |
| Shape Flexibility | Right-skewed | Flexible (varies with shape) | Right-skewed |
| Common Applications | Finance, biology | Reliability, life data | Queuing, insurance, rainfall |
| Origin | Multiplicative processes | Time-to-failure modeling | Summation of exponential events |
Conclusion
While Lognormal, Weibull, and Gamma distributions are all continuous and positive, their applications differ based on the nature of the data. Understanding their characteristics allows analysts, engineers, and researchers to select the most suitable distribution for accurate modeling and prediction. Whether modeling financial growth, product reliability, or natural events, choosing the correct distribution is essential for meaningful statistical analysis.