In the world of statistics, the Normal Distribution stands as one of the most essential and widely used continuous probability distributions. It is often called the “bell curve” because of its smooth, symmetric shape centered around the mean. This distribution plays a vital role in understanding natural variation, analyzing data, and making predictions across industries such as manufacturing, business, and healthcare.
What Is the Normal Distribution?
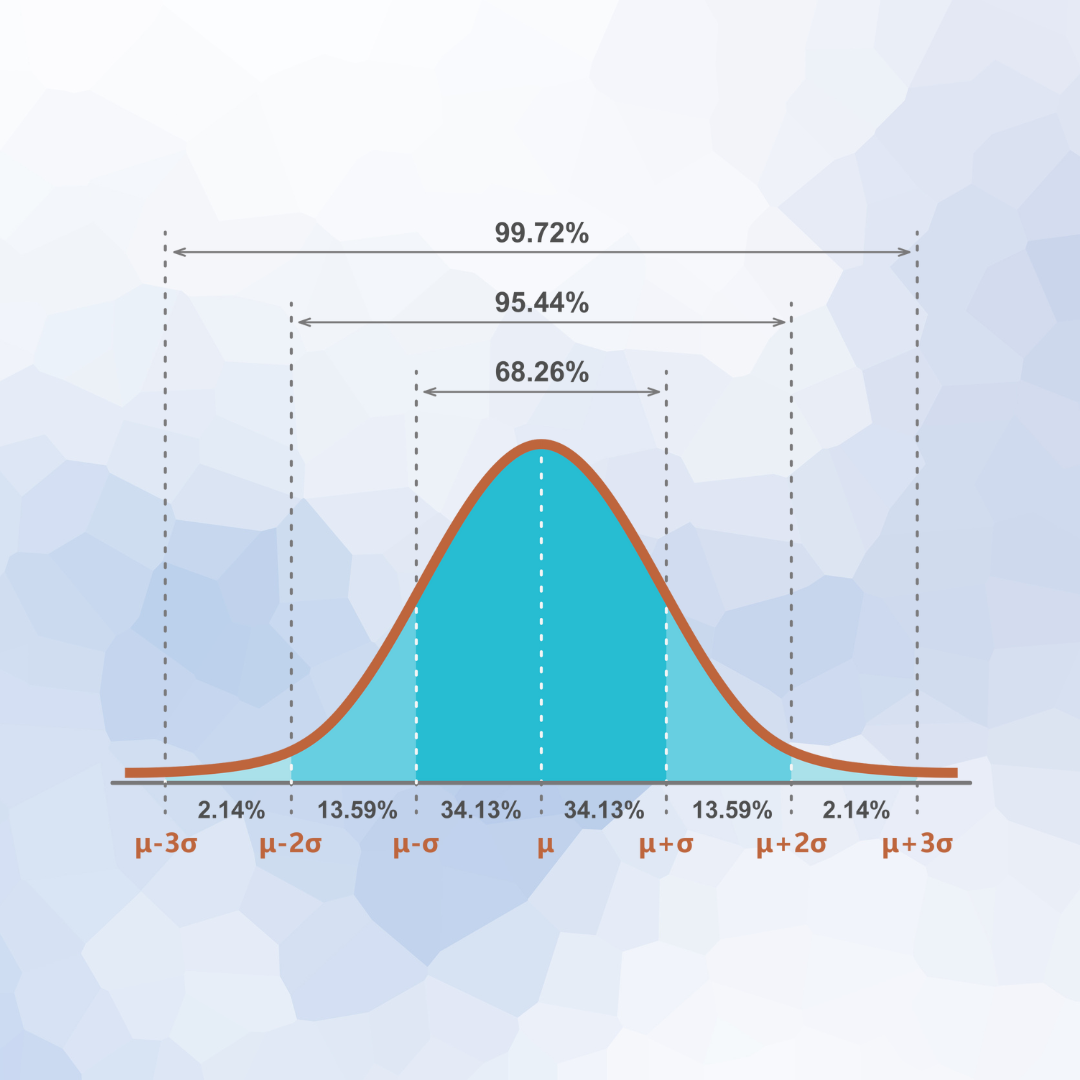
The Normal Distribution describes how continuous data values are spread around a central point (the mean). Most values cluster near the mean, while fewer values appear at the extremes. The pattern forms a bell-shaped curve that is symmetrical — meaning the left and right sides are mirror images.
In a normal distribution:
- About two-thirds of the data fall near the mean.
- Extreme values (very high or low) are rare.
- The curve represents natural variation in many real-world situations.
Why the Normal Distribution Is Important
The Normal Distribution is the foundation of many statistical techniques, including control charts, hypothesis testing, and regression analysis. It allows analysts to:
- Predict probabilities of certain outcomes.
- Evaluate how typical or unusual a data point is.
- Understand variability and process performance.
Because many natural and human processes tend to follow this pattern, it is often referred to as the “natural law of variation.”
Real-Life Example: Quality Control in Manufacturing
Imagine a company producing metal rods designed to be 10 mm in diameter. In reality, small variations occur due to machine precision, material consistency, or temperature changes. When the diameters of thousands of rods are measured and plotted, they typically form a bell-shaped curve — most rods are close to 10 mm, with fewer slightly smaller or larger.
Quality engineers can use this pattern to:
- Determine if the process is stable.
- Identify if too many rods fall outside acceptable limits.
- Take corrective actions when the process deviates from the expected normal pattern.
This example highlights how the normal distribution helps monitor process consistency and product quality — two critical aspects of modern manufacturing.
The Role of the Normal Distribution in Decision-Making
Beyond manufacturing, the normal distribution applies to many fields:
- Finance: Stock returns often follow a normal pattern.
- Healthcare: Blood pressure or body temperature distributions help identify normal and abnormal readings.
- Education: Test scores typically cluster around an average, showing performance variation among students.
By understanding how data behaves in a normal distribution, decision-makers can distinguish between common variation (natural differences) and special causes (unusual or problematic changes).
Conclusion
The Normal Distribution is the cornerstone of continuous data analysis. Its bell-shaped curve elegantly captures the essence of natural variation, helping analysts, engineers, and researchers understand how values cluster around a central point. From quality control to risk management, the normal distribution remains an indispensable tool for describing reality, identifying trends, and improving decision-making in every data-driven field.